

Key Points
No.1
Last Week in Review
1
US Stocks Volatile for Three Weeks, Semiconductors Lead Declines, China Concepts Lead Gains
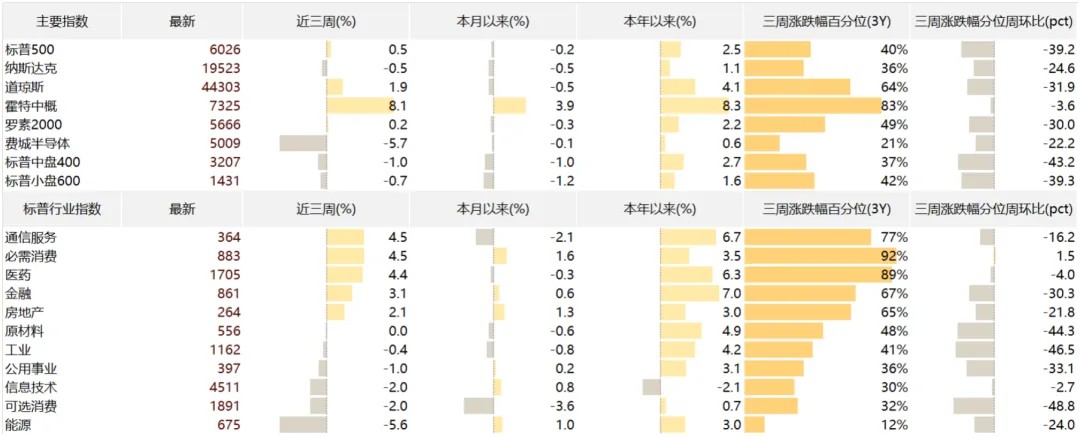
①The S&P 500 has experienced overall volatility.
The S&P 500 rose 0.5% over the past three weeks. By index, the Dow Jones Industrial Average gained 1.9%, the Nasdaq fell 0.5%, the Russell 2000 rose 0.2%, and the Philadelphia Semiconductor Index dropped 5.7%. During this period, China's high-performance DeepSeek model triggered a sell-off in the AI sector, raising questions about the artificial intelligence growth narrative. In contrast, Chinese assets performed strongly, with the Hang Seng Index rising 7.9% and the US-listed China Concepts stocks surging 8.1%. American semiconductor upstream suppliers faced pressure, weighing on large-cap growth stocks. Subsequently, as technology giants released financial reports and higher-than-expected capital expenditure projections for 2025, the Philadelphia Semiconductor Index began to recover. Additionally, as capital rotated from hardware to software and defensive sectors, the major indices delivered respectable performance over the three-week period. However, volatility surrounding Trump's tariff policies introduced periodic market fluctuations.
Chart: US Stock Market Overview
Source: Factset, Gopher Asset Management
Trading Recap
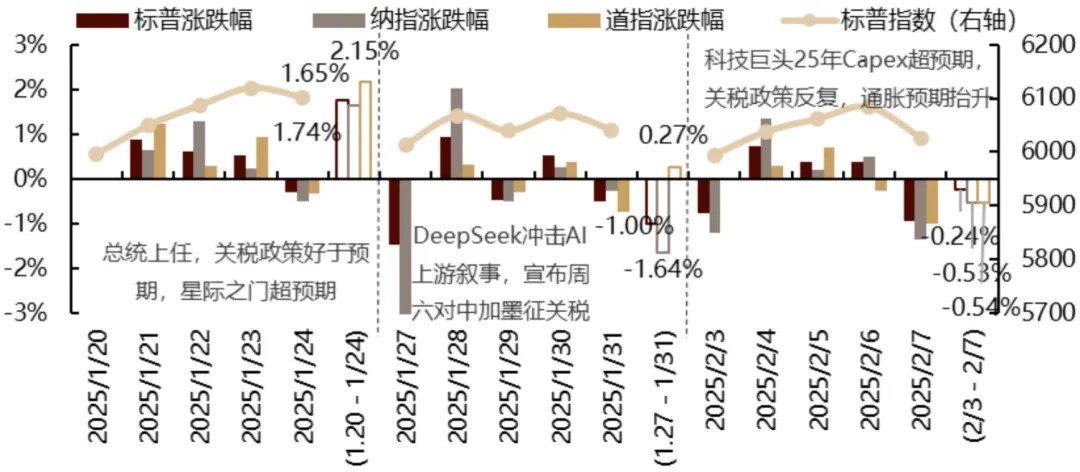
In the first week (January 21-24), market focus centered on Trump's post-inauguration policy initiatives. His relatively dovish stance on tariffs (no immediate implementation, no mention of broad-based tariffs, and a less aggressive approach toward China than anticipated) and the "Stargate" AI investment plan drove market gains from Tuesday through Thursday.
In the second week (January 27-31), markets grappled with the challenge posed by DeepSeek's cost-effective model to the US capital expenditure narrative and industry leadership position. A sharp semiconductor sector declines on Monday dragged down the Nasdaq, leading broader market indexes lower. On Tuesday, the indices partially recovered these losses. From Wednesday through Friday, markets fluctuated amid evolving tariff policy proposals and mixed Q4 earnings results from the Magnificent Seven technology companies.
In the third week (February 3-7), market attention shifted to potential recovery in the semiconductor sector and adjustments to the economic narrative (from "soft landing" to potential "stagflation"). Aggressive weekend tariff statements by Trump triggered a global risk-off response, causing a sharp Monday decline in US equities, with the Nasdaq leading losses. From Tuesday through Thursday, bolstered by technology giants' higher-than-expected capital expenditure forecasts, the semiconductor index advanced 3.4% over three sessions. On Friday, a surge in short-term inflation expectations in the Michigan consumer survey dampened rate cut expectations and, combined with concerns about further tariff policy escalation the following week, prompted a sell-off in US equities, with technology stocks leading the decline.
Chart: Daily Market Movement
Source: Factset, Gopher Asset Management
January 20 (Monday): US markets closed for holiday. Trump's inauguration speech featured a dovish policy stance that exceeded market expectations. Tariff increases were presented as more systematic than feared, energy policies emphasized deflationary measures, and immigration policies maintained a hard line.
January 21 (Tuesday): US markets rose, led by value and small-cap segments. Dow +1.24%, S&P 500 +0.88%, Nasdaq +0.64%, Russell 2000 +1.85%. Market breadth was positive, with the S&P 500 equal-weight index outperforming. Among large technology companies, Apple underperformed as its Q4 smartphone sales in China declined 18%, falling to third position behind Huawei and Xiaomi.
January 22 (Wednesday): Most US indices advanced. Dow +0.30%, S&P 500 +0.61%, Nasdaq +1.28%, Russell 2000 -0.61%. Market breadth turned negative. Most large technology stocks gained, with Nvidia and Microsoft outperforming. The "Stargate" plan (focused on AI infrastructure investment) highlighted AI's long-term growth potential. The Q4 earnings season began positively, with Netflix's strong performance and upgraded guidance enhancing sentiment. Tariff policy uncertainty persisted, with Mexico and Canada as focal points. Trump threatened tariffs on China and the EU, though near-term impacts appeared milder than initially feared.
January 23 (Thursday): US markets advanced, led by value-oriented sectors. Dow +0.92%, S&P 500 +0.53%, Nasdaq +0.22%, Russell 2000 +0.47%. Improving market breadth supported broader market gains. Most large technology companies weakened, with AI-related investments surrendering recent gains and semiconductor shares softening. However, SK Hynix reported record Q4 revenue and projected over 100% growth in 2025 HBM sales. Trump appeared at Davos, reiterating his primary policy objective (tax reduction) and advocating for an "immediate" interest rate cut, without introducing new tariff proposals. Weekly initial jobless claims modestly exceeded market expectations, and continuing claims also surpassed forecasts, increasing slightly.
January 24 (Friday): US markets lacked clear direction, with major indices fluctuating throughout the session. Dow -0.32%, S&P 500 -0.29%, Nasdaq -0.50%, Russell 2000 -0.30%. The Bank of Japan raised interest rates by 25 basis points as widely anticipated. The January Michigan consumer confidence index fell short of expectations, with one-year inflation expectations jumping from 2.8% in December to 3.3%, reaching the highest level since May 2024.
January 27 (Monday): US markets declined sharply, with the Nasdaq leading losses among major indices. Dow +0.65%, S&P 500 -1.46%, Nasdaq -3.07%, Russell 2000 -1.03%. China's AI startup DeepSeek launched a cost-competitive open-source model, raising concerns about sustained capital expenditure growth, American technology leadership, increasing market concentration risks, and potential escalation in US-China trade tensions. US semiconductor, AI, utilities, and power-related equities fell significantly amid heightened uncertainty surrounding the AI growth narrative. Investment capital rotated toward defensive, cyclical, and downstream software sectors, benefiting companies like Apple. On the economic front, December new home sales exceeded expectations, reaching the highest level since September. Weekend reports indicated Trump's advisors advocated imposing 25% tariffs on Mexico and Canada before February 1 to strengthen negotiating leverage regarding immigration, narcotics, and USMCA reforms.
January 28 (Tuesday): US markets recovered some losses, with the Nasdaq leading gains. Dow +0.31%, S&P 500 +0.92%, Nasdaq +2.03%, Russell 2000 +0.21%. Large technology stocks led the advance, with Nvidia reclaiming a portion of its previous losses and Apple maintaining stability. Tariff discussions dominated headlines alongside AI developments. Trump indicated global tariff rates would substantially exceed the 2.5% recently proposed by Treasury Secretary Benton, pledging duties on semi-finished products, pharmaceuticals, steel, copper, and aluminum, while threatening automotive production in Canada and Mexico. Additionally, Trump ordered a freeze on federal funds for public loans and grants. Regarding economic data, December durable goods orders missed expectations, though core capital goods orders showed improvement. November's Case-Shiller and FHFA home price indices both surpassed forecasts.
January 29 (Wednesday): US markets closed lower. Dow -0.31%, S&P 500 -0.47%, Nasdaq -0.51%, Russell 2000 -0.25%. The equal-weighted S&P 500, which underperformed Tuesday due to broad market weakness, showed modest improvement. Bloomberg reported the White House had initiated preliminary discussions regarding potential restrictions on Nvidia's sales of H20 chips to China. Most large technology stocks declined. Reports indicated the administration was reversing the federal grant freeze announced Monday evening, while Commerce Secretary nominee Lutnick expressed support for broad tariff implementation. The January FOMC meeting maintained existing interest rates as expected, with a hawkish policy statement acknowledging the resilient labor market and elevated inflation. Powell adopted a more dovish tone, indicating the Fed need not act hastily regarding policy rates and would assess the economic impact of Trump's policies before adjusting monetary stance. CME futures data reflected a 70% probability of maintaining rates at the March meeting pending greater clarity on Trump's policies and inflation trajectory, with markets not anticipating rate cuts before June.
January 30 (Thursday): US markets closed higher. Dow +0.38%, S&P 500 +0.53%, Nasdaq +0.25%, Russell 2000 +1.07%. Earnings from major technology companies dominated market narratives. Meta and Tesla gained following their results, while Microsoft underperformed. Reports indicated OpenAI was in discussions to raise capital at a $34 billion valuation. Trump announced plans for 25% tariffs on Canada and Mexico effective Saturday, temporarily pressuring markets. Microsoft's Q4 Azure growth and Q1 guidance fell short of expectations; Meta achieved record sales and profits driven by AI initiatives; Tesla's performance benefited from new model expectations and full self-driving prospects despite lower automotive revenue and average selling prices. Economic data showed initial jobless claims decreased to 207,000, below consensus forecasts. Continuing claims likewise surprised positively. Q4 GDP slightly missed expectations at 2.3%, down from Q3's 3.1%. Q4 core personal consumption expenditure inflation reached 2.5%, meeting expectations and increasing from Q3's 2.2%. The December pending home sales index unexpectedly declined, ending four consecutive months of growth. Trump reiterated intentions to implement 25% tariffs on Canada and Mexico.
January 31 (Friday): US markets displayed volatility and modest weakness. Dow -0.75%, S&P 500 -0.50%, Nasdaq -0.28%, Russell 2000 -0.86%. Most large technology stocks advanced, though Apple declined following its earnings release. The White House confirmed implementation of US tariffs on Mexico and Canada beginning Saturday. Trump announced tariffs on semiconductors, oil, gas, steel, aluminum, and copper effective February 18. Policy uncertainty persisted, though markets increasingly viewed these measures as negotiating leverage rather than permanent economic fixtures. Economic data showed December PCE inflation at 2.8% year-on-year, matching consensus expectations. Personal income aligned with forecasts, while personal spending increased more than anticipated. Federal Reserve Governor Bowman maintained a hawkish stance, emphasizing continued progress needed on inflation and suggesting current rates were unlikely to significantly constrain price pressures. Chicago Fed President Goolsbee expressed optimism regarding the inflation trajectory but noted that as rates approach neutrality, the pace of monetary easing might moderate.
February 3 (Monday): Aggressive weekend tariff comments from Trump prompted US market declines. Dow -0.28%, S&P 500 -0.76%, Nasdaq -1.20%, Russell 2000 -1.28%. Most large technology stocks retreated, though Meta demonstrated relative strength. Trump's tariff announcement exceeded market expectations in its aggressiveness, triggering global risk aversion. However, subsequent developments partially alleviated market concerns, particularly Mexican President Sheinbaum's proposal to delay tariffs for one month in exchange for increased border security measures. Markets increasingly interpreted these tariffs as diplomatic leverage with limited long-term implications. Economic data revealed a January ISM Manufacturing Index of 50.9, surpassing expectations. New orders, production, and employment components showed strength, alongside rising prices. Boston Fed President Collins noted the central bank would anticipate tariff-driven price increases in policy deliberations. Atlanta Fed President Bostic highlighted elevated uncertainty and emphasized the significance of tariff policies in the economic outlook. The Treasury's first-quarter borrowing estimate reached $81.5 billion, slightly below the previous $82.3 billion projection.
February 4 (Tuesday): US markets advanced, largely erasing Monday's losses. Dow +0.30%, S&P 500 +0.72%, Nasdaq +1.35%, Russell 2000 +1.41%. Large technology stocks led gains. Markets rebounded strongly following a two-day retreat driven by tariff concerns. Though tariff threats and volatility persisted, market sentiment improved following preliminary agreements between Mexico, Canada, and the Trump administration. China implemented measured retaliatory actions following US tariff announcements, while Trump indicated dialogue with President Xi would occur at an appropriate time. Economic data showed JOLTS job openings missed expectations, reversing part of November's increase, with minimal change in the quit rate. San Francisco Fed President Daly emphasized underlying economic strength and indicated monetary policy was appropriately calibrated, though the Federal Reserve remains attentive to evolving policy dynamics.
February 5 (Wednesday): US markets edged higher despite weaker-than-expected ISM Non-Manufacturing PMI data and some relief from dollar strength. Dow +0.71%, S&P 500 +0.39%, Nasdaq +0.19%, Russell 2000 +1.14%. Market breadth improved incrementally, with the equal-weighted S&P 500 outperforming. Tariff policy concerns moderated in the near term as market focus shifted toward fundamental factors. Large technology stocks delivered mixed performance; Google's capital expenditures exceeded expectations, but its cloud business missed targets and displayed decelerating growth, raising efficiency concerns and prompting selling pressure. Conversely, robust capital expenditure projections from Google, Microsoft, and Meta enhanced upstream earnings expectations, supporting Nvidia's advance. Economic indicators showed strong January ADP private employment data, upward revisions to December figures, and robust growth in consumer-facing industries, though other sectors demonstrated weakness. January ISM Services fell short of expectations, with new orders reaching their lowest level since June, while employment strengthened and supplier prices moderated. The Treasury's quarterly refunding statement aligned with expectations, maintaining unchanged auction sizes for 3-year, 10-year, and 30-year securities. Richmond Fed President Barkin noted Trump's policies introduced significant uncertainty but still favored monetary policy adjustments this year. Chicago Fed President Goolsbee highlighted declining inflation approaching the central bank's target, though potential tariff impacts might exceed those observed in 2018.
February 6 (Thursday): US markets continued their modest upward trend, anticipating Friday's non-farm payroll data. Dow -0.28%, S&P 500 +0.36%, Nasdaq +0.51%, Russell 2000 -0.39%. Most large technology stocks advanced, with Nvidia maintaining its positive momentum while Tesla declined. Treasury Secretary Benton reaffirmed focus on 10-year yield dynamics, indicated cryptocurrencies would not fundamentally alter the fiscal system, and reiterated support for China tariffs and permanent tax reductions. Economic data showed weekly initial jobless claims slightly exceeding expectations, accompanied by increased continuing claims.
February 7 (Friday): Elevated short-term inflation expectations in the Michigan consumer survey dampened rate cut expectations and, combined with concerns regarding potential tariff policy escalation the following week, triggered a sell-off in US equities, with technology stocks leading declines. Dow -0.99%, S&P 500 -0.95%, Nasdaq -1.36%, Russell 2000 -1.19%. Most large technology stocks retreated, with Amazon, Tesla, and Google notably underperforming. Economic data showed January non-farm payroll growth below consensus forecasts, though with substantial upward revisions totaling 100,000 jobs for the preceding two months. The unemployment rate improved from 4.1% to 4.0%, while average hourly earnings growth accelerated from 0.3% to 0.5%. The Los Angeles wildfire had no discernible economic impact. The 2024 annual employment revision was negative. The February consumer confidence index declined to its lowest level since November 2023. Inflation expectations for the coming year surged by one percentage point to 4.3%, the highest since November 2023, while the five-to-ten-year inflation expectation rose by 0.1 percentage points to 3.3%, reaching the highest level since June 2008. The January Manheim used car value index increased to its highest level since December 2023. Federal Reserve Governor Kugler indicated that given robust labor market conditions and economic uncertainty, maintaining the federal funds rate for an extended period would be prudent. Dallas Fed President Logan questioned the necessity for additional rate reductions. Minneapolis Fed President Kashkari emphasized the uncertainty surrounding tariff policies and noted the critical importance of upcoming inflation readings.
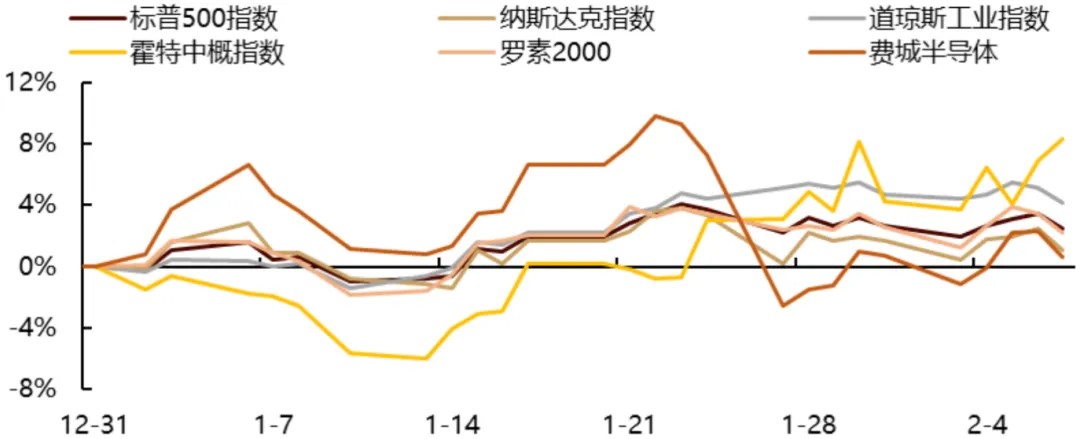
Chart: YTD Performance of Major Indices
Source: Factset, Gopher Asset Management
②Defensive sectors, downstream AI software, and rate-sensitive cyclical sectors lead gains
By sector, S&P industry groups have delivered mixed performance over the past three weeks. Defensive healthcare, communication services benefiting from AI upstream investment rotation, and rate-sensitive financials contributed most significantly to index gains. These sectors also reported solid Q4 earnings, providing fundamental support. The information technology sector exerted the greatest negative pressure on overall index performance.
In terms of absolute returns, communication services, consumer staples, healthcare, and financials led advances. Energy underperformed amid Trump's pro-traditional energy policy stance. Information technology and consumer discretionary followed, impacted by substantial valuation adjustments.
Chart: S&P Sector Performance Contribution

Source: Factset, Gopher Asset Management
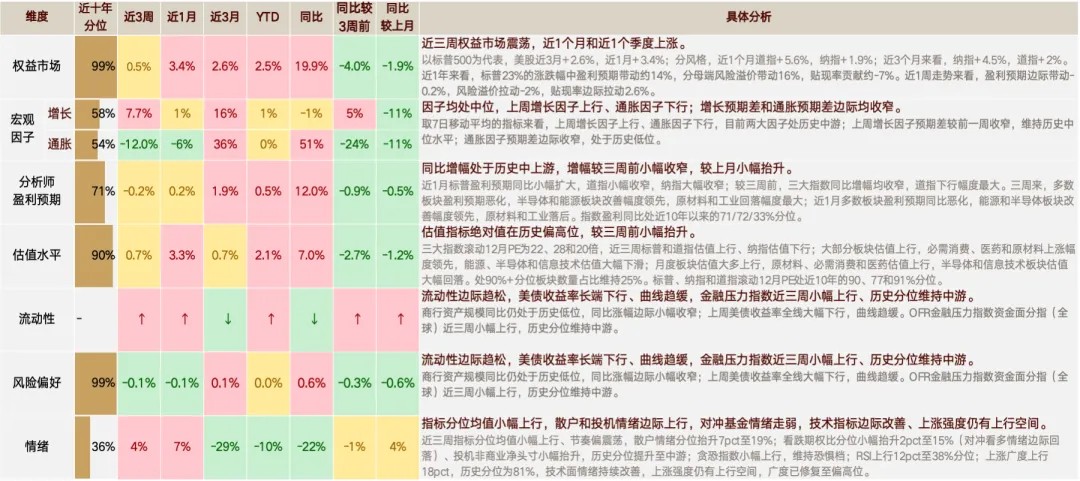
③Earnings expectations fluctuate, liquidity improves marginally, and risk preference moderates
Over the past three weeks, major indices have traded within a defined range with a slight upward bias. Liquidity conditions have been the primary driver of improvement. Earnings expectations have experienced a marginal decline, contributing -0.16% to index returns; valuations have increased incrementally, with improved liquidity adding 2.6% to index performance; risk appetite has moderated slightly, detracting 1.99% from overall index returns.
Chart: US Stock Market Return Contribution Analysis

Chart: Trend of US Stock Market Return Contribution Components (Past Year)

来源:Factset、歌斐资产
2
Earnings Expectations Growth Rate Narrows Marginally
The year-over-year growth rate of earnings expectations has contracted slightly compared to previous periods. Forward-looking indicators suggest the S&P 500's earnings are projected to grow steadily on a year-over-year basis. The Nasdaq's year-over-year earnings growth rate is expected to moderate, while the Dow Jones Industrial Average's year-over-year earnings outlook remains relatively subdued. The Philadelphia Semiconductor Index's year-over-year earnings growth momentum is likewise anticipated to decelerate. For 2025, year-over-year earnings expectations for the S&P 500, Dow Jones, and semiconductor index are forecast to peak in Q3 before declining, while the Nasdaq is expected to reach its peak in Q2 before moderating. Compared to the preceding three-week period, 2025 earnings projections for major indices have been revised downward.
The year-over-year earnings expectations for the S&P 500, Nasdaq, and Dow Jones currently stand at the 71st, 72nd, and 33rd percentiles, respectively, relative to the past decade. Over the past month, the S&P 500's year-over-year earnings expectations have expanded marginally, while the Dow Jones has contracted slightly and the Nasdaq has declined significantly. Compared to three weeks ago, year-over-year growth projections for all three major indices have narrowed, with the Dow Jones experiencing the most substantial reduction.
On a sector basis, over the past three weeks, earnings expectations for most segments have deteriorated. The semiconductor and energy sectors have demonstrated the greatest improvement, while materials and industrials have recorded the largest declines. Over the past month, year-over-year earnings expectations for most sectors have weakened. Energy and semiconductors have shown the strongest improvement, while materials and industrials have significantly underperformed.
Chart: S&P Earnings Expectations vs. Actual Growth Rates

Chart: S&P Earnings Expectations vs. Actual Growth Rates
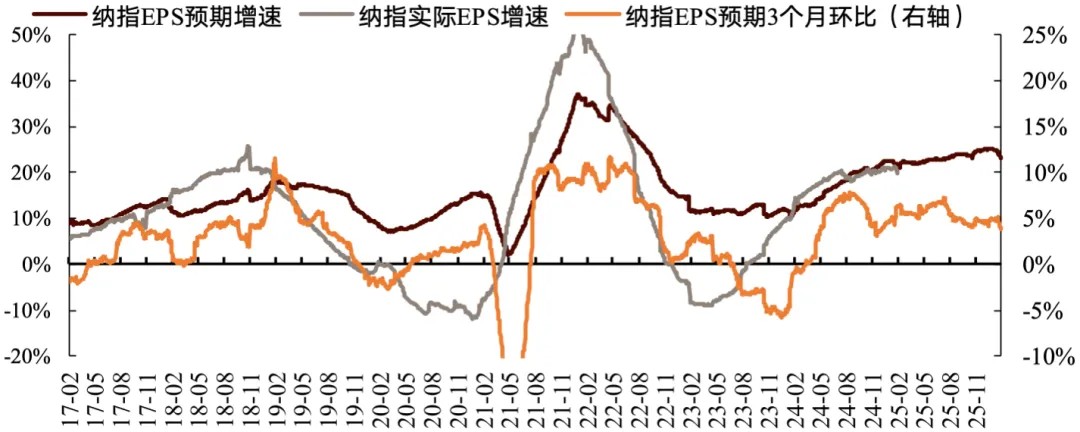
Chart: Dow Jones Earnings Expectations vs. Actual Growth Rates

Chart: Philadelphia semiconductor Earnings Expectations vs. Actual Growth Rates

Chart: S&P 500 Quarterly Actual Earnings and Earnings Expectations Year-over-Year Trends

Chart: Nasdaq Quarterly Actual Earnings and Earnings Expectations Year-over-Year Trends
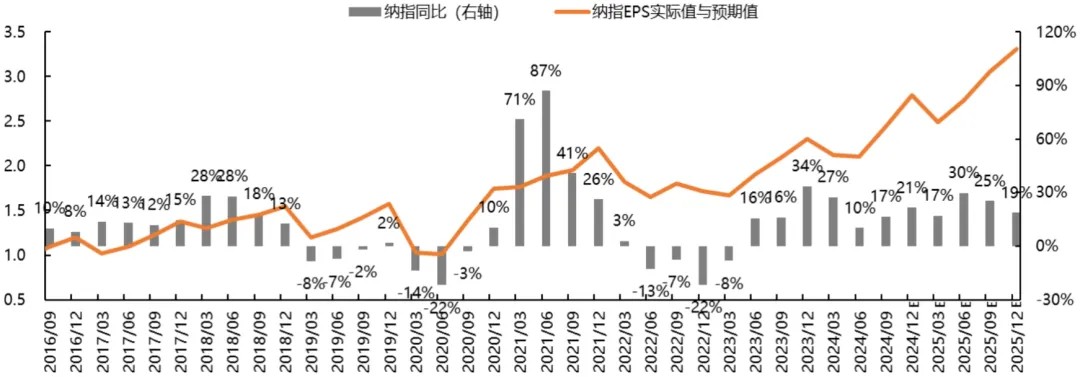
Chart: Dow Jones Quarterly Actual Earnings and Earnings Expectations Year-over-Year Trends
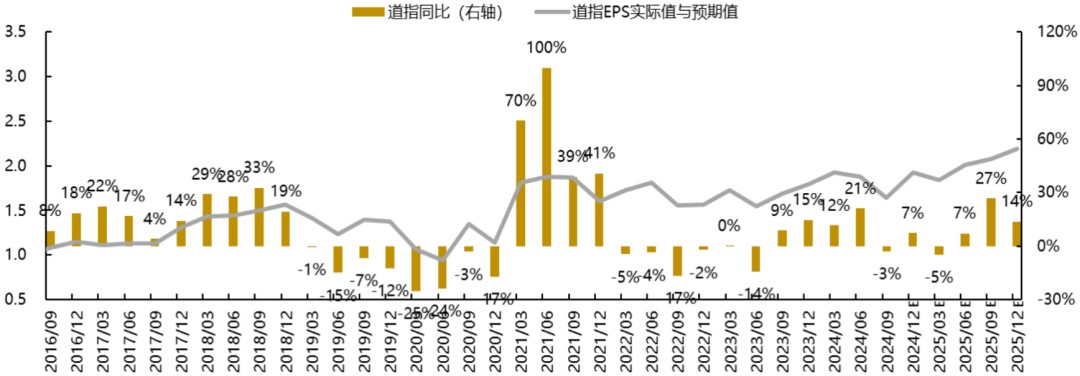
Chart: Philadelphia Semiconductor Index Quarterly Actual Earnings and Earnings Expectations Year-over-Year Trends

Table: Revised Earnings Estimate Levels for Major Indices

Source: Factset, Gopher Asset Management
3
Liquidity Conditions Improve Marginally
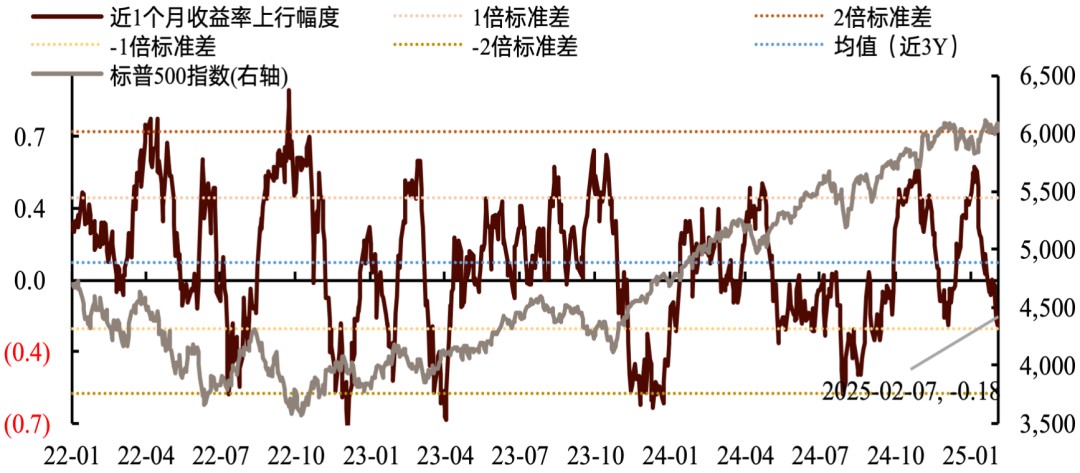
Liquidity conditions improved slightly last week. First, commercial bank assets remained at historically low year-over-year levels, with the year-over-year growth rate narrowing marginally. Second, Treasury yields declined across the maturity spectrum, flattening the yield curve. Regarding timing, long-term Treasury yields fell significantly during three primary risk events: January 27 (DeepSeek's impact on the AI narrative), February 3 (following Trump's weekend tariff comments regarding China, Canada, and Mexico), and February 5 (when January ISM Services data missed expectations). During other trading sessions, yields fluctuated within a range. Third, the OFR Financial Stress Index increased modestly over the past three weeks, though it remains at moderate levels from a historical perspective.
Chart: Commercial Bank Assets Year-over-Year\

Chart: US Treasury Yields

Chart: OFR Financial Stress Index (Global)

Chart: St. Louis Fed Financial Stress Index (United States)

Chart: Magnitude of Increase in 10-Year US Treasury Yield
Source: Factset, Gopher Asset Management
4
Risk Preference Moderates, Sentiment Indicators Improve Slightly
Risk appetite, already at historically elevated levels, has declined incrementally. The S&P 500's equity risk premium (ERP) has increased over the past month and continued rising during the past three weeks, indicating deteriorating risk sentiment, with the Nasdaq experiencing the most pronounced decline. Regarding timing, market risk appetite deteriorated sharply on January 27 due to DeepSeek's market impact, with additional modest deterioration on February 3 amid tariff policy concerns and on February 5 following disappointing non-manufacturing PMI data. During other trading sessions, risk sentiment primarily fluctuated within a range. The VIX index rose slightly, maintaining its historical percentile at mid-range levels (45%), having increased by 4 percentage points over the past three weeks. The implied volatility for the next 30 days, as priced by options market participants, has likewise increased marginally. Overall market anxiety has fluctuated modestly, with short-selling pressure remaining at neutral levels.
Chart: ERP Trends of Major Indices

Source: Factset, Gopher Asset Management
Sentiment indicators have improved slightly on average, with retail and speculative sentiment strengthening marginally while hedge fund positioning has weakened. Technical indicators have improved incrementally, with upward momentum maintaining room for further expansion. Over the past three weeks, the average percentile of sentiment indicators has risen slightly, though with variable progression. Retail sentiment has increased by 7 percentage points to 19%; the put-call ratio has edged up by 2 percentage points to 15% (indicating a marginal decline in bullish sentiment hedging activity), and speculative non-commercial net positions have risen slightly, elevating their historical percentile to mid-range levels. The Fear and Greed Index has improved but remains in fear territory. The Relative Strength Index has advanced 12 percentage points to the 38th percentile, while market breadth has surged 18 percentage points, reaching the 81st percentile historically. Technical sentiment continues to strengthen, with momentum indicators retaining upside potential, while market breadth has recovered to relatively robust levels.
Chart: Retail Sentiment

Chart: Hedge Fund Positioning

Chart: Speculative Sentiment

Chart: RSI

Chart: Market Breadth Indicators

Source: Factset, Gopher Asset Management
Chart: CNN Fear & Greed Index

Source: CNN, Gopher Asset Management
5
Valuations Edge Higher Incrementally
Valuation metrics have increased marginally from already elevated historical levels. The trailing 12-month price-to-earnings (PE) ratios for the three major indices stand at 22, 28, and 20, respectively. Over the past three weeks, the S&P 500 and Dow Jones have experienced valuation expansion, while the Nasdaq has contracted slightly. Across most sectors, valuations have increased, with consumer staples, healthcare, and materials leading advances. Conversely, energy, semiconductors, and information technology have recorded significant valuation compression. On a monthly basis, most sectors have witnessed valuation improvement, with energy and semiconductors demonstrating the most substantial gains, while materials and industrials have lagged considerably. The proportion of sectors in the 90th percentile or higher for valuations has remained steady at 25%. The trailing 12-month PE ratios for the S&P 500, Nasdaq, and Dow Jones currently stand at the 90th, 77th, and 91st percentiles, respectively, relative to the past decade.
Chart:PE(LTM)
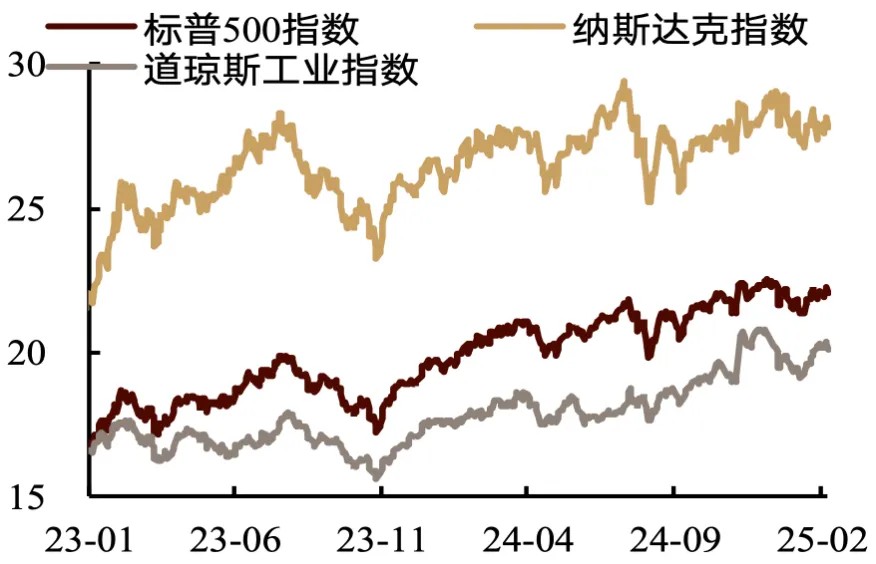
Chart:PB-ROE

Source: Factset, Gopher Asset Management
Chart: long-term PE trends

Source: Gopher Asset Management
No.2
Maintain a Weekly Buy (+1) Rating for US Stocks
We maintain our weekly Buy (+1) rating for US equities. The medium-term recession risk remains low, and our fundamental thesis of progression from soft landing to recovery remains intact, supporting our continued constructive outlook on US stocks. Recently, markets have been influenced by multiple factors, including policy deliberations, Q4 earnings results, and adjustments to AI industry narratives, contributing to the sideways trading pattern since January 20th, with directional clarity still lacking. Looking ahead, noise from presidential policy debates will persist, but pragmatic considerations suggest Trump will likely prioritize addressing voters' inflation concerns. Broadly speaking, the policy outlook appears moderately positive, with tariffs and other potentially restrictive policies functioning primarily as negotiating leverage, suggesting relatively modest overall impact on US equities. Recent economic indicators reinforce the "soft landing" narrative, and given the data-dependent nature of monetary policy, this week's January core inflation release will significantly influence market dynamics.
From a fundamental perspective, the macroeconomy maintains its resilience, and Q4 earnings expectations have strengthened year-on-year compared to Q3. On the valuation front, near-term risk appetite is being constrained by policy uncertainties and AI industry narrative adjustments, suggesting potential for further consolidation, while valuations have room to expand following the recent pullback. For the week ahead, we maintain our Buy rating on US equities.
Structurally, we recommend a "barbell approach" for the medium term, focusing on software sectors benefiting from the broadening of AI industry sentiment and small-cap/cyclical sectors positioned to benefit most from Trump's proposed tax reforms. Key risks to monitor include unexpected deterioration in policy implementation and timing, stronger-than-anticipated inflation data, and weaker-than-expected Q4 earnings. Particular attention should be paid to style rotation dynamics, macroeconomic narrative evolution, risk appetite trends, and policy certainty.
Chart: Weekly Market Indicators

Source: Gopher Asset Management
No.3
Focus for the Week
On the macroeconomic front, this week's primary focus will be Wednesday's release of January core CPI data. As markets navigate a resilient yet gradually moderating fundamental backdrop, inflation readings represent a significant potential catalyst at this juncture.
Chart: Weekly Market Calendar

Source: Gopher Asset Management
No.4
Appendix
【Attachment 1】Macroeconomic Factor Update
Chart: U.S. Growth Factors

Chart: U.S. Inflation Factors

Source: Factset, Gopher Asset Management
【Attachment 2】 Earnings Trend Analysis
Chart: Global ROE Long-Term Trend

Chart: Global ROE Short-Term Trend

来源:Bloomberg、Factset、歌斐资产
【Attachment 3】S&P Earnings Estimates by Sector (Year-over-Year)
Table: S&P Earnings Estimates by Segment vs. Actual Earnings (Year-over-Year)


Source: Factset, Gopher Asset Management
【Attachment 4】 S&P Valuation (PE NTM) Trends by Sector
Table: S&P Valuation by Sector


Source: Factset, Gopher Asset Management
【Attachment 5】Year-to-Date Sub-Sector Earnings and Valuation Tracking
Table: Sub-Sector YTD Performance

Source: Factset, Gopher Asset Management
【Attachment 6】S&P 500 Earnings Surprise Analysis
Table: S&P 500 Earnings Surprise Index

Notes:
· Compared to the previous period: This refers to the difference between the current indicator and the same period last week.
· Current proportion of S&P 500 companies reporting earnings: As of now, 62% of companies in the S&P 500 have reported their earnings, an increase of 53 percentage points compared to three weeks ago.
· Absolute performance: Overall earnings have exceeded Q3 expectations and market consensus. The proportion of companies beating expectations stands at 77%, up from the previous period. In relative terms, the Q4 beat rate is stronger than the levels seen in Q1-Q3 of 2024, which were +12%, +30%, and -25%, respectively. The Q4 earnings surprise magnitude is higher than Q2's 3.68% and Q3's 4.60%. However, the proportion of companies exceeding expectations is lower than Q2's 79.23% but higher than Q3's 74.74%.
【Attachment 7】Performance Tracking of Top Seven Technology Stocks
Table: Performance Statistics of Key Constituents

Source: Wind, Factset, Gopher Asset Management
【Attachment 8】 US-China Trade Conflict Monitoring
Table: U.S.-China Trade Conflict Event Tracking

¹ In this report, the year-over-year growth rate of trailing 12-month earnings expectations refers to the percentage change between the trailing 12-month earnings expectations and the actual earnings for the previous 12 months.
END
Disclaimer


